Type: Developer DAO
Title: Addition of historical prices in a graph for each token in wallet along with improved display
Funding: Pre-Funded
Max Reward (Create): 20,000 $GRAPE
Max Reward (Complete): 1,000 $USDC
Date Created: 04/26/2022
Date Complete: 05/11/2022
Restrictions: implement into live dashboard after testing and grant approval
Language: CSS / React / Javascript
Submission Instructions:
Contribute to the Grape GitHub repo Grape Labs · GitHub in specific Grape-Labs/grape-dashboard
Description:
The information available when a users views a token in the dashboard is limited and with a little effort can be improved dramatically. Current view of a token in the portfolio area of the Grape dash is shown below:
This bounty focuses on adding a price selection tabbed area called “price” which is displayed when a user click the down arrow for each token. It will include a historical graph of the token’s performance with options to switch the timeframe with suggested ranges of 1D, 1W, 1M, 1Y and ALL depending on what is available for the token.
Deliverable:
- When a user clicks on the “down arrow” the content display should be broken into two sub sections. This bounty focuses on the first “Price” section and a separate bounty will be created for the Info section.
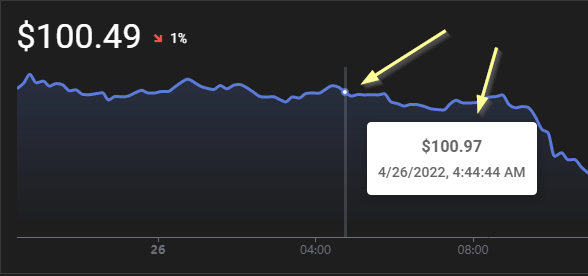
a) The first default section shows a price for the token, % change in price (for the chart period selected) along with a nice looking graph. There should be selectable timeframes for the display as shown. Colours should follow Grape’s colour scheme as pictured below.
b) When you mouse over an area on the graph it will show the price along with the date/time stamp like below.
Ref: I took the sample graph and date/time screens from Sonar only as an example. It is not the intention to copy them exactly. But their setup gives the perfect illustration of what is needed.
Acceptance Criteria:
- Design works in a responsive manner (on phones, smaller screens), is clean and follows the existing Grape color scheme / theme.
- Charting redraws, is updated and maintains display if the reload icon is used.
- Price w/ Date and Time should be shown when you hover over an area in the chart
- Any code added will not break any existing dependencies and is integrated into the existing repo. Libraries may be updated and build can be updated as long as all existing functionality is compliable.


